A Weekend on the Stage
Re-analysing a FUCCI movie from 2010
In 2010 I left HeLa cells on a confocal for a weekend to see whether they would survive. The raw data is long gone, but one compressed QuickTime export survived. Sixteen years later it was enough to recover the channels, track 959 cells through three generations, and finally answer the question properly.
In 2010 we ran a control experiment that every live-cell imaging lab runs sooner or later. Before trusting a multi-day time-lapse on the confocal, we needed to know whether the cells would survive it: sixty hours in a stage-top incubator, with heat, CO₂, humidity and a laser passing over them every five minutes.
The cells were HeLa expressing FUCCI, the cell-cycle reporter that makes this easy to read by eye. Nuclei glow red in G1, turn yellow at the G1/S transition when both reporters are present, and glow green through S, G2 and M. After division the daughters go briefly dark, then turn red again. A healthy population keeps cycling through those colours. A stressed one stalls.
We watched the movie, saw cells dividing, and moved on. That was the whole analysis.
The raw data didn’t survive the following sixteen years. What did survive was a single QuickTime export, carried from backup to backup. This September I gave that file to Claude Code to see how much it still held. The answer turned out to be: almost everything.
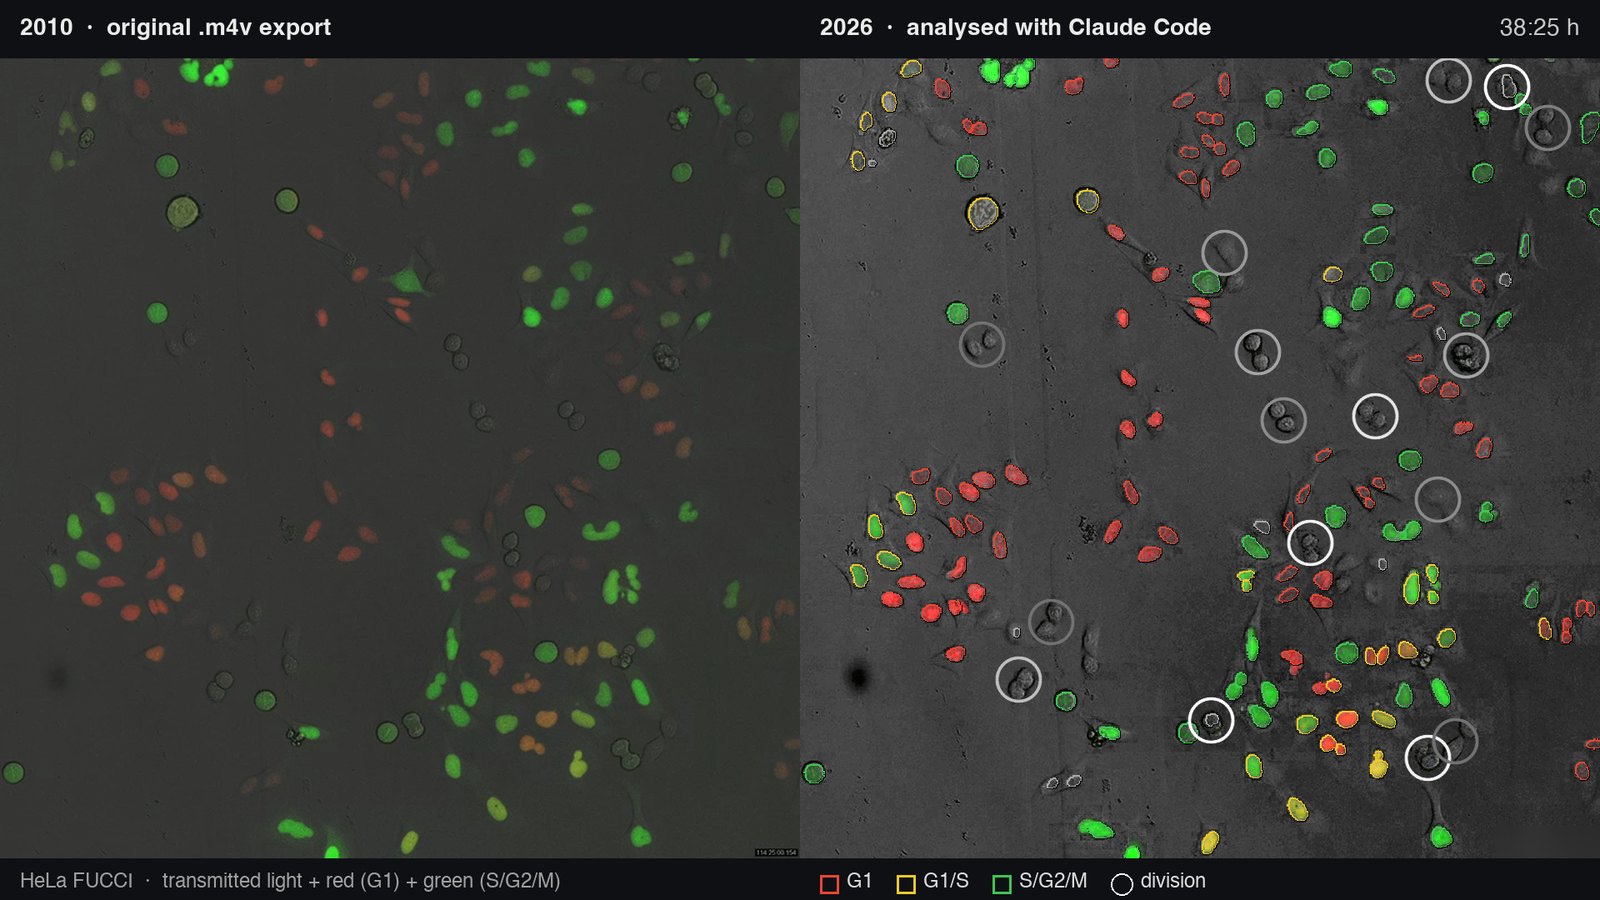
Frame 461, 38 h 25 min. Left: the 2010 export as it was. Right: the analysis, with nuclei outlined by phase call (red G1, yellow G1/S, green S/G2/M) and white rings on divisions in the preceding hour.
What survived
The file is 37 MB. Its header says it was written on 4 June 2010 at 17:19 UTC by CoreMediaAuthoring 700, CoreMedia 484.5, i386: an “Export for iPod/Apple TV” from the Snow Leopard era. That’s the date of the export, so the imaging happened some time before it. Inside are 721 frames of 720 × 720 pixels, 8-bit colour, with the transmitted-light image and both fluorescence channels merged into one picture. No objective, no pixel size, no laser powers, no channel names. By any sensible standard it’s a presentation file, not data.
Getting the channels back
The merge is less destructive than it looks. The grey transmitted-light (TM) image adds the same amount to red, green and blue, while the FUCCI colours were rendered into red and green only. So the channels come apart by subtraction: transmitted light is roughly the blue channel, FUCCI red is red minus blue, and FUCCI green is green minus blue. With the timestamp in the corner masked out, that gave three clean 721-frame stacks.
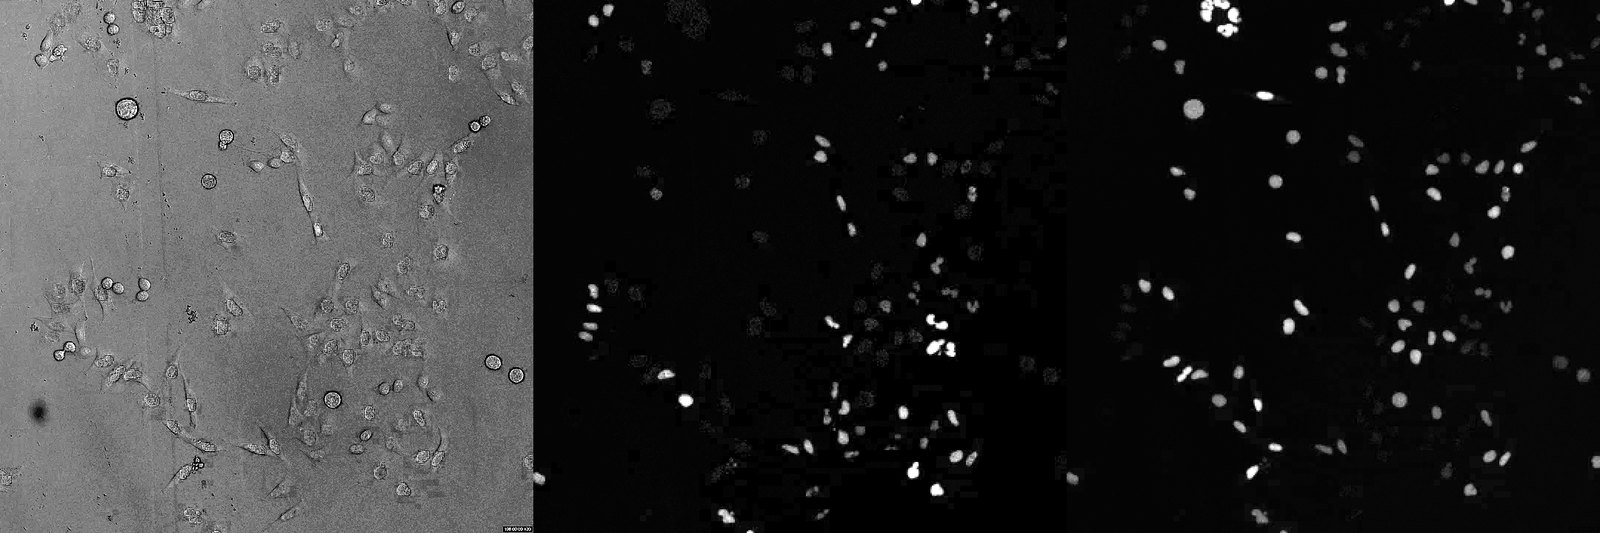
One frame, three channels, recovered from the merged colour video: transmitted light, FUCCI red, FUCCI green.
Getting the time back
With the metadata gone, the frame interval had to come from the picture. The burned-in clock was readable when enlarged. Frame 1 reads 00:05:00 and frame 100 reads 08:20:00. Frames 360 and 720 briefly looked like 106 and 212 hours, until it became clear that the leading “0” was a small “d”: 1d 06:00:00 and 2d 12:00:00. Every stamp agrees on five minutes per frame and sixty hours in total.
Finding nuclei
Nuclei were segmented with StarDist, a deep-learning model for round-ish objects, using its pretrained fluorescence model on the brighter of the two FUCCI channels at each pixel. Upscaling the frames made it split nuclei, so it ran at native resolution. Across the movie it found 109,950 nuclei, growing from 52 in the first frame to about 290 at the end.
Finding divisions the old way
FUCCI has a blind spot for tracking. After anaphase the green signal disappears, and the daughters stay dark for one to two hours before red appears. A tracker that only sees fluorescence loses every cell at every division, exactly when you most want to follow it.
The fix is a trick every microscopist of my generation knows. Cells round up for mitosis, and in transmitted light a rounded cell carries a bright, thick halo. Run an edge filter over the image and those halos are the strongest signal in the frame. A circle finder with a score for how complete the rim is picks them out, and a filter for spots that never move removes the dust. The result is a mitosis detector that doesn’t depend on fluorescence at all.
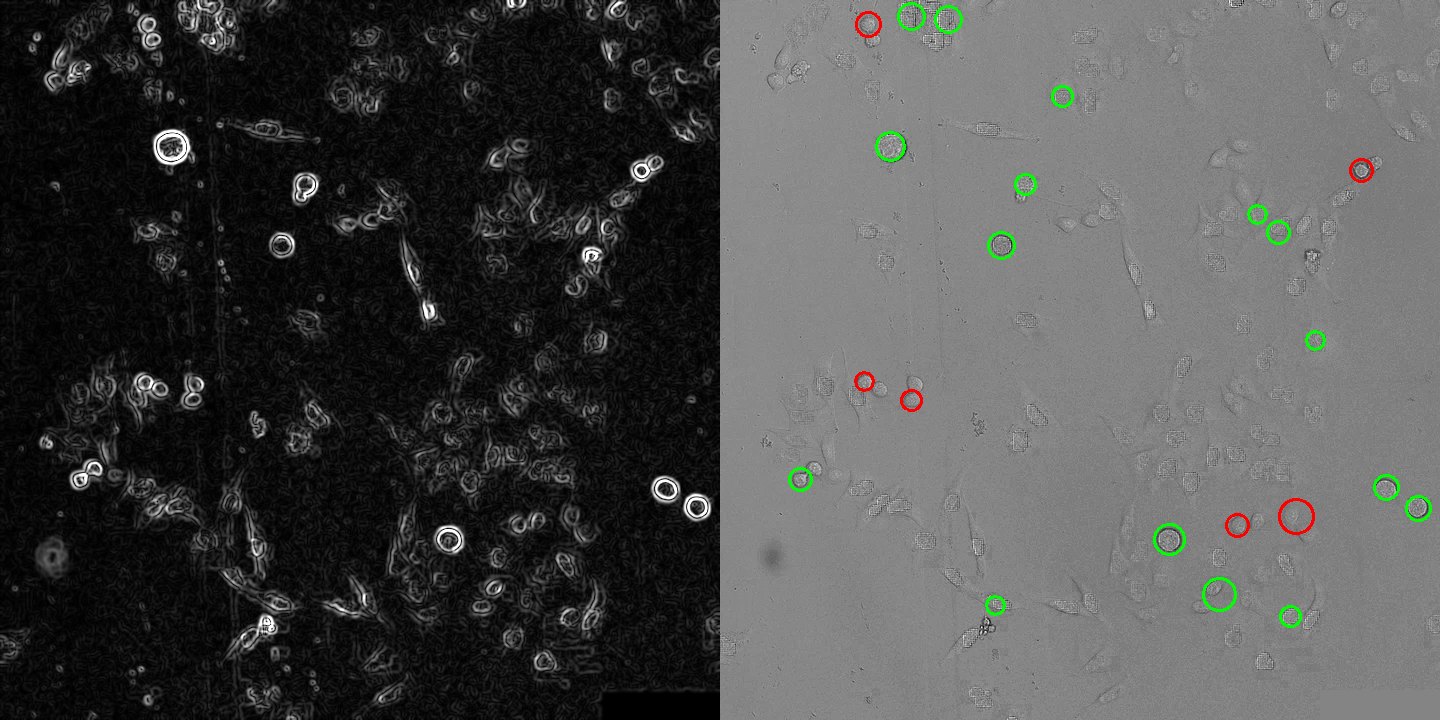
Edge strength (left) and detected rounded cells (right). Green circles contain a fluorescent nucleus, red ones don’t: either dead cells or cells in the dark window just after division.
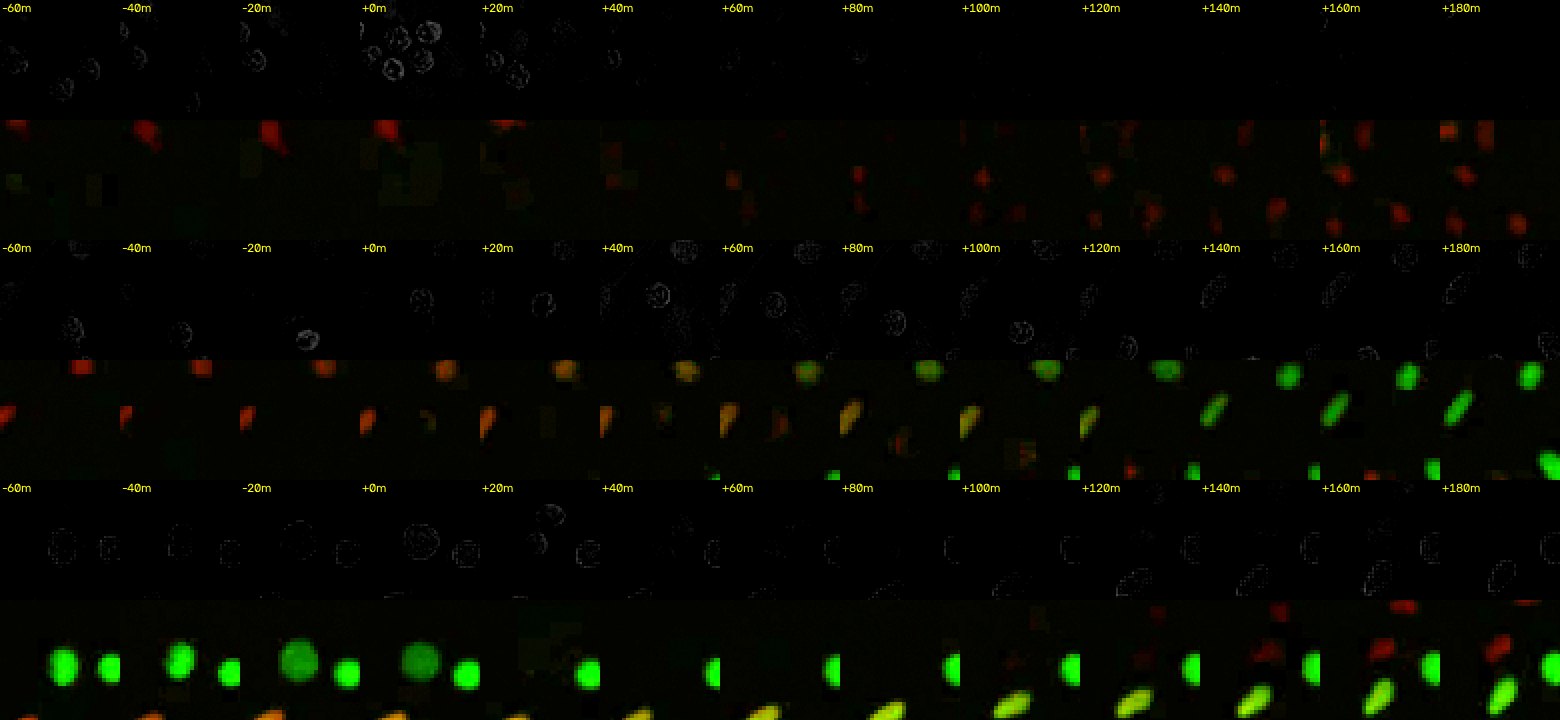
Three events at 20-minute steps. Top: a rounded cell whose daughters appear dimly red 40–100 minutes later. Middle: a clean red → yellow → green G1/S transition. Bottom: a green nucleus swells as its envelope breaks down, vanishes, and returns as two faint red daughters about two hours later.
Tracking and lineages
The cells here move slowly: half a pixel per frame on average. btrack linked the nuclei frame by frame into 2,634 track pieces. A lineage step written for this data then did what generic trackers find hard:
- Gap closing: it joined pieces of the same nucleus lost for up to an hour, provided the colour matched.
- Division linking: it connected a mother track that ended green to up to two daughter tracks that started red or dark nearby within three hours. A rounded-cell ring at the mother’s last position strengthened the link.
The ring detector turned out to be decisive. 99% of accepted divisions have a ring at the right place and time, against 16% for random positions. The final count: 959 cells and 256 divisions, 205 of them with both daughters found.
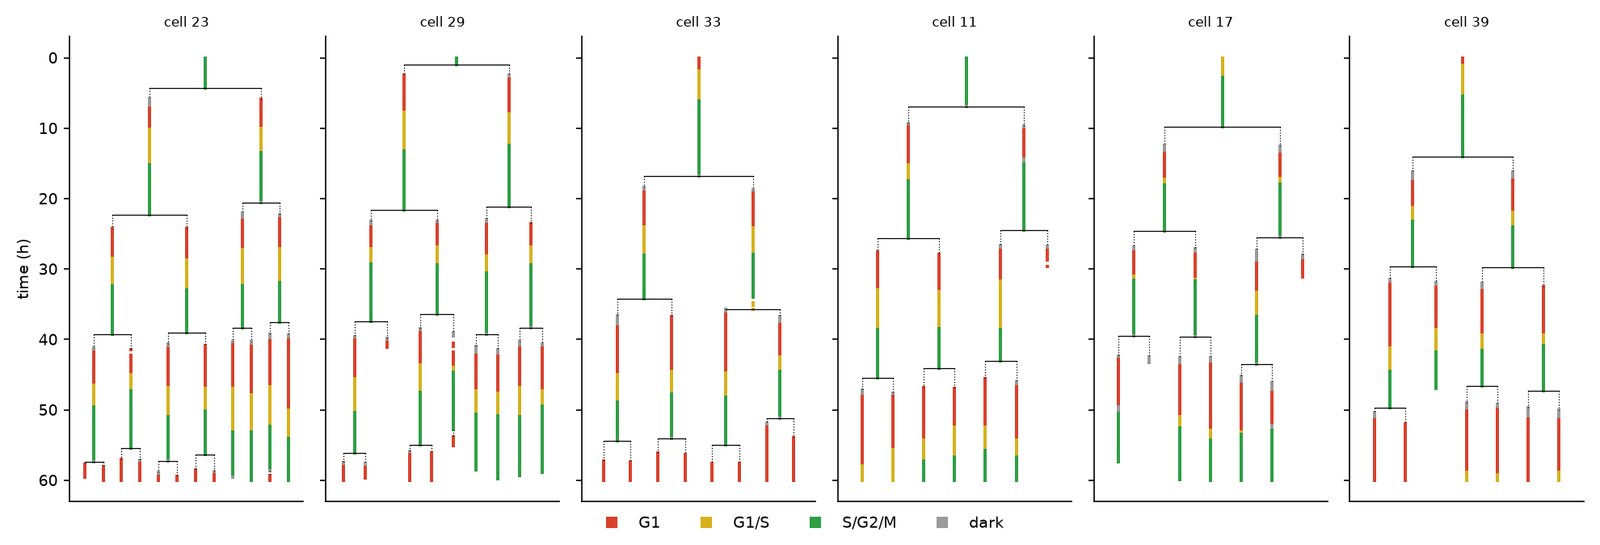
The six largest families. Time runs downwards. Each branch passes red → yellow → green → division → grey gap → red, over up to three generations.
Cell-cycle timing
Phases follow the usual FUCCI convention. The division time is the last frame of the mother’s nucleus, around anaphase. G1 runs from division to green onset, including the dark gap. S/G2/M runs from green onset to the next division.
| Measure | n | Median | IQR |
|---|---|---|---|
| Cell cycle (division → division) | 155 | 17.9 h | 16.3–19.5 h |
| G1 (division → green onset) | 292 | 8.5 h | 7.1–10.8 h |
| S/G2/M (green onset → division) | 203 | 10.3 h | 9.2–11.8 h |
| Population doubling (from counts) | – | 23.0 h | – |
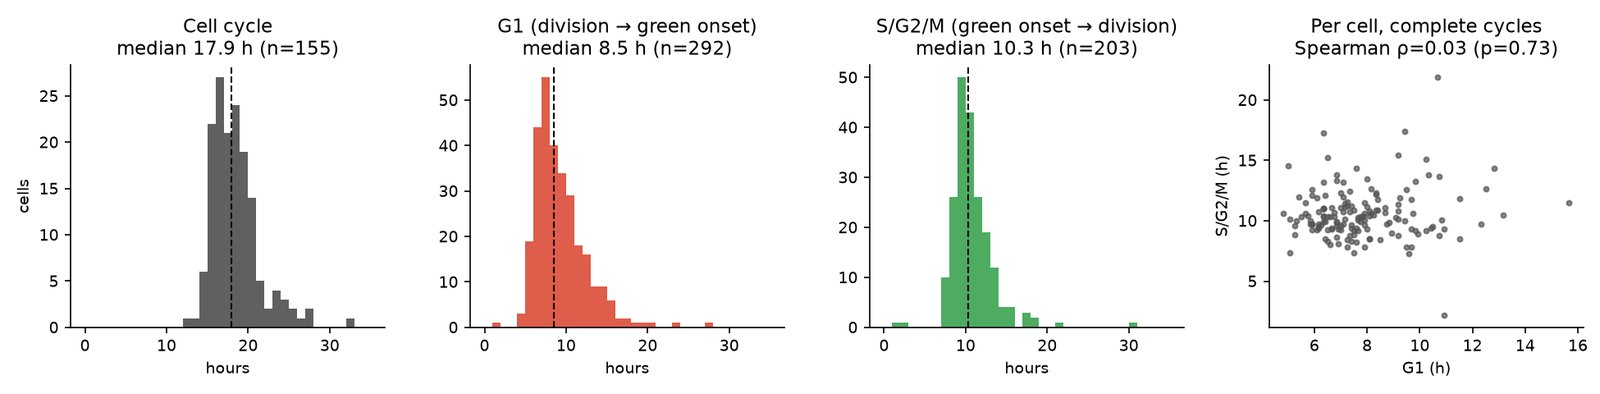
Distributions. Per cell, the lengths of G1 and S/G2/M are unrelated (Spearman ρ = 0.03).
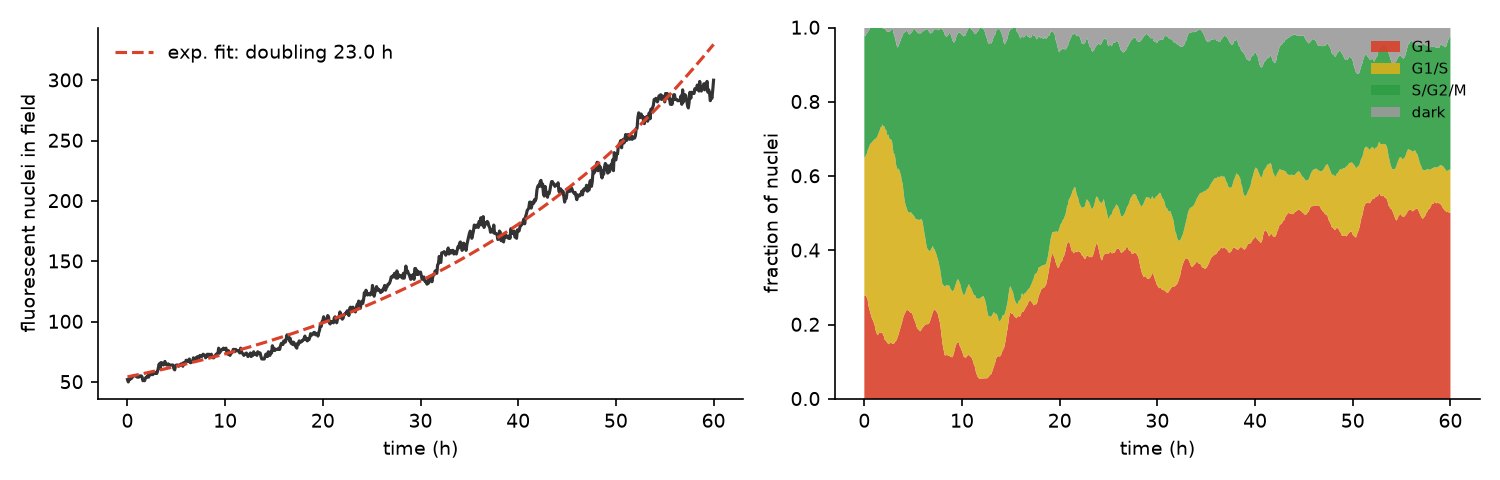
Population. Counts grow with a 23-hour doubling time. The phase mix shows the culture started partly synchronised near G1/S, followed by a wave of divisions at 15–25 hours.
Several checks suggest the numbers can be trusted. Restricting the analysis to cells born early enough for a long cycle to fit in the movie doesn’t move the median (17.8–17.9 h), so the 60-hour window isn’t biasing it. Sister cells have strongly correlated cycle lengths (ρ = 0.72, median difference 55 minutes), while mothers and daughters barely correlate (ρ = 0.28). That’s the well-known pattern of real mammalian lineages, and a mis-linked tracker would scramble it.
Families make synchronised clusters
The phase map looked patchy: neighbouring cells tended to share a colour. To measure this, I compared how often pairs of nuclei share a phase with how often they would if the phase labels were shuffled at random over the same positions, and split the pairs by relatedness.
| Neighbour pairs within 50 px | Same phase | If random | Ratio |
|---|---|---|---|
| Sisters | 98% | 53% | 1.86 |
| First cousins | 91% | 52% | 1.74 |
| Unrelated | 74% | 54% | 1.37 |
| Aunt and niece | 12% | 53% | 0.23 |
Relatives make up 16% of neighbour pairs but produce 28% of the excess same-phase pairs. Division timing loosens by generation: sisters divide a median 0.9 hours apart, first cousins 1.5 hours, unrelated cells born around the same time 3.7 hours. Relatives match at any distance, while unrelated cells match only when close. Sisters drift apart by less than one nucleus width in a day, which is why families stay visible as clusters. The aunt-and-niece row is a good sanity check: one generation apart, they sit on opposite sides of the cycle.
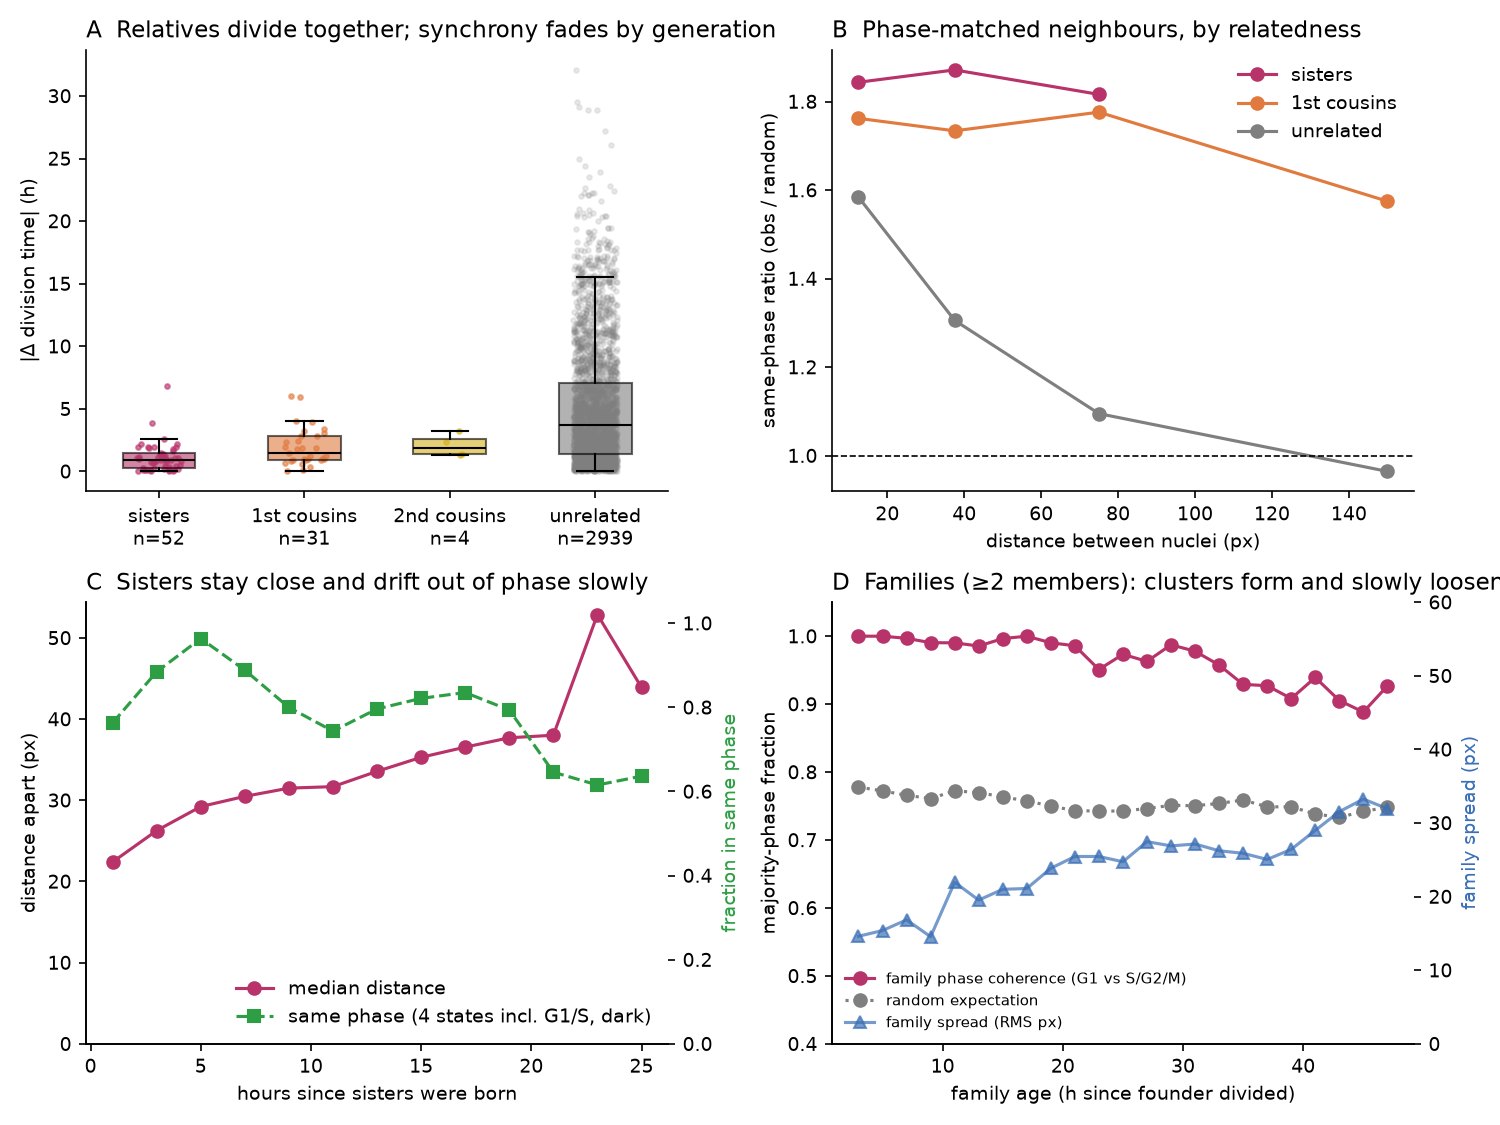
Lineage clustering. (A) Synchrony fades by generation. (B) Relatives match phase at any distance, while unrelated neighbours match only when close. (C) Sisters stay close and fall out of step only near their next division. (D) Families from the first sister pair onward: fully in phase at first, still 90% at 48 hours against 74% by chance.
These are lower bounds. Cells present in the first frame have unknown ancestry, so sisters born before recording count as unrelated.
Did they survive the weekend?
Yes. The cells proliferated through all sixty hours.
| Indicator | 0–24 h | 36–60 h |
|---|---|---|
| Nuclei in field | 59 → 101 | 180 → 288 |
| Cell cycle, median | 16.8 h | 18.4 h |
| S/G2/M, median | 10.3 h | 9.6 h |
| Time spent rounded in mitosis | 145–185 min | 70–75 min |
| Rounded cells that never divide, per 100 | 14 → 5 | 3 → 2.5 |
Cycle times stayed stable, S/G2/M didn’t lengthen (it’s the phase that stretches with DNA damage), mitoses were normal after the first day, and dead cells didn’t accumulate. The stage didn’t drift and the lamp stayed steady.
Three findings are worth acting on before longer runs:
G1 lengthens with time on the stage, and crowding doesn’t explain it. Median G1 rose from 6.6 hours for cells born early to 10.4 hours for cells born after 35 hours, while S/G2/M stayed near 10 hours. At the same local density, late-born cells still spend longer in G1. With two to four neighbours, for example, it rose from 7.1 to 9.9 hours. In a joint model, time on the stage explains the effect and local density adds nothing. The likely causes act on the whole dish: medium being used up or acidifying, evaporation, or accumulated light dose. A single field of view can’t tell them apart.
The green reporter fades by about half. Measured in the same phase, each cell’s green signal falls from 0.78 to 0.40 over sixty hours, while red falls only from 0.55 to 0.45. That points to photobleaching of the green protein at five-minute imaging, a sign of light dose rather than damage in itself. The caveat: a change in display settings during the 2010 export would look the same.
Mitosis ran long on the first day, about 2.5 to 3 hours against 70–75 minutes later. This could be the cells settling into the incubator, or left over from how the culture was prepared.
The next control run should include an unimaged well, photographed only at the start and the end. It should also image fluorescence every fifteen minutes with transmitted light every five, since transmitted light alone is enough to find divisions. And it should keep the raw files.
What this can’t say
The source is a lossy, 8-bit, display-scaled export, so every intensity here is relative, and distances are in pixels because the pixel size is lost. Division and phase calls have been checked by internal consistency and by eye on examples, but not yet against a hand-annotated set. A few multinucleated cells, present from the first frames, are over-counted as several nuclei, though they never divide and so stay out of the timing statistics. And it’s one field, from one run, on one weekend.
Same tricks, thirty-seven years apart
In 1989 I wrote software to track vesicles during cell division. An Image-1/AT video processor board did the pixel work, a program in Borland C under MS-DOS did the analysis, the tracks went into dBASE IV, and the reports were printed from Lotus Manuscript 2.1. A 512 × 512 frame took 256 KB, so two frames filled everything DOS would give me. The method was forced by the machine: compute the changes in space and time, mask the places where something is happening, and spend the scarce memory only there.
That’s the idea that made this analysis work: edges to find rounded cells, colour changes to find phase transitions, and event masks to bridge the dark gap after every division. The difference is the headroom. One channel of this movie takes 1.4 GB, and the whole pipeline, from export file to lineage statistics, was built in an evening with Claude Code.
The instruments have changed beyond recognition. I wrote about that in A Microscope for a Mind. The habit of looking closely where the signal changes has not. And a file I had written off as a presentation copy turned out to be data all along.